O-Week Workshops Not Enough for Sexual Harassment Awareness: Edict Survey Reports
By Anushree Pratap (UG ‘23) and Ishita Ahuja (UG ‘23) A survey conducted from August 6
Aashay Verma, Class of 2019
(Author’s note: I understand how this can be problematic, a man writing on women’s representation, but having crunched all the Ashoka-related data I’m going to use in this article myself, I felt only I could best articulate what I wanted to convey with it)
The issue of women’s representation in world politics has been around for centuries now. Starting from the simple right to vote to other seemingly complicated legal rights, women have always had to fight their way through.
According to World Bank data, the proportion of seats held by women in national parliaments worldwide has jumped from 11.7% in 1990 to 23.65% in 2017, more than a 100% increase. Leading the world in women representation is Rwanda, with an impressive 61% of the seats in parliament held by women. India still has a long way to go, standing at rank 145, with 12% of the parliament seats held by women. The figure for 2017 shows that even though there has been a push in countries around the world to give women more positions of power, a lot of work is still to be done.

The situation is much better when it comes to Ashokan politics. To be fair, though, we are an undergraduate body of roughly 1000 people and the world has over 7.6 billion people, so the statistics are not comparable. We can, however, compare this year’s Ashoka data with last year’s, which is exactly what I intend on doing.
Using the information made available to entire student body by the Ashoka University Election Commission (AUEC), I compiled data to analyze women representation in our university’s student politics. The analysis will be party-wise.
Dhamma
Rising to power with 188 votes in 2017–18, Dhamma’s women representation in its candidate list was almost half:

For parties, the ranking of a candidate on the candidate list can have a bearing on whether they get elected or not. This was specially true of Dhamma in last year’s elections. From a 15-candidate list, 7 made it to the house, 6 of whom were the first 6 ranks of the list. The average rank of a woman on Dhamma’s list was 10.28, while for men it was 6, a little more than half of the former. It is therefore not surprising that only 2 of the 7 Dhamma members who made it to the House were women.
This year, Dhamma has decided to not contest in elections.
Prakrit
One of Ashoka’s longest-running parties, Prakrit had a proportion of women in its candidate list similar to that of Dhamma’s:

The startling fact about Prakrit’s representatives in last year’s House of Representatives (HoR) was that even though there were more women in the candidate list, all 4 Prakrit members in the HoR were men. This was in spite of the fact that the average ranking for Women in its list (8.875) was relatively closer to that of Men (7), if we compare with Dhamma. The list had 15 people.
This year, Prakrit is back with a new 14-member list, but the proportion of women in the list has fallen:

The average ranking for women, however, has improved to 8.33, with that of men improving to 6.87, but this could be because they have one less candidate running this year. Topping the list is also a woman, Esha Datanwala. The list this year has a lot of fresh faces with the current third and fourth-year undergraduates bidding farewell to their university lives.
Samiti
In an e-mail to the entire student body on 30th January, 2017, Saptarshi Basak (Pixie), the founder of Samiti, wrote on behalf of the party:
“ We somehow feel that the exclusive nature that the political parties on campus are so quick to deny, can only further be explained by their impotency, lip-service and mailed clarifications that move no one…..We are attempting to form a new party, a party called Samiti which won’t be run by toothless dogma, but by a persistent pursuit of veritable change.”
Samiti gained instant popularity across campus and managed to bag 97 votes, giving them 3 seats in the HoR. The gender-composition of its list looked like:

With 2/3rd’s of the list being populated by men, it was not surprising that all 3 members of Samiti in the HoR were also men. The average ranking of women in Samiti’s candidate list was 9.6, more than that of men, whose average ranking was much higher at 6.9. A few months after the new government was formed, Zoheb Bedi, Samiti’s top-performing candidate, resigned from the house. To make up for the empty spot, Dhamma brought in Samyak Shami.
After their first election cycle, Samiti disbanded.
Independent Candidates
Last year, Ashoka’s elections had only 2 independent candidates, both women: Aarushi Aggarwal and Srishti Bansal. Both of them got elected to the house.
This year there has been a meteoric 400% rise in the number of independent candidates to 10 individuals. The gender distribution, however, shows a large divide:

Moving to Election season 2018–19, we have seen the founding of 3 new parties: Bringing Justice to the People (BJP), Moksh, and Independents’ Bloc.
Bringing Justice to the People (BJP)
In an email to the entire student body on 1st February, 2018, Anindya Longvah, BJP candidate, wrote wrote on behalf of the party:
“ The BJP started out as a joke. However, as we progressed and gained members, we realized how acute the need for a new party is….We discovered new friends. We found a new family…. However, WE WANT TO GIVE POWER TO YOU. Therefore, all Ashokans are hereby given the opportunity to add issues/points to our manifesto; THE ASHOKAN MANIFESTO.”
The party has roped in Srishti Bansal, who ran independently last year, as its presidential candidate. The gender distribution of its candidate list looks like:

BJP is the only party with a 15-candidate list this year. The average ranking of women in the party list is 8.16, as against 7.88 for men. Considering that 60% of the candidates are men, the average rankings suggest an even distribution in the list.
Moksh
Arnav Mohan Gupta, in his email to the entire student body on 4th February 2018, introduced the party as:
“ Ashokan Politics is in its phase of revolution. Unprecedented volume of voters, emergence of new parties, turbulence within old ones. It is certainly the age of renewal. With this thought in mind, we proudly present Moksh.”
The party has submitted a list of 14 candidates to the AUEC, whose gender composition looks like:

With a 50–50 distribution between Men and Women, Moksh seems like the party with the best representation of women. That is till we look at the average ranking of women in its list: 8.57, compared to 6.42 for men. Since both Prakrit and Moksh have a list of 14 representatives this time, we can compare the averages directly. This comparison tells us that even though Moksh has more women in its list than Prakrit does, the latter has ranked women in its list higher than the former, albeit only marginally.
Independents’ Bloc
Finally, we come to Independents’ Bloc. Having a short party list of 6 people, this party was the last of the new parties to have formal communication with the Student Body:
“ We are a group of individual candidates who feel that the party-system has let us down this cycle. We are united by one common vision.”
The 6 people comprise of 3 men and 3 women, giving the gender composition chart this look:

However, this can be misleading, because looking at the average ranking of men and women in the party’s list paints a different picture. On an average, women are ranked at 4.33, compared to 2.66 for men. We must keep in mind, however, that the list only has 6 names. An even placement of alternating between men and women along the ranks, i.e. ranks 1,3,5 for women and 2,4,6 for men (or vice versa), would have yielded averages of 3 and 4 respectively.
Having analyzed the candidate lists of all parties that will contest this year and those that contested last year, I made this observation:
The average ranking for women in the candidate lists leading up to elections 2017–18 was 9.55, compared to 6.65 for men. This is based on data from 3 parties with 15 candidates each.
This year, the average ranking of women has risen to 9.05, and that of men has fallen to 7.33. This is based on data from 4 parties, having 15, 14, 14, and 6 candidates. For those parties with less than 15 candidates, I normalized the rankings for uniformity.
If there were to be an equal ranking of men and women in party lists, i.e. 1,3,5,7..15 for women and 2,4,6,8..14 for men (or vice versa), the average ranking for both men and women would have been 8. Any figure higher than 8 means lesser representation, and a figure lower than 8 means better representation.
We can hence conclude that the overall representation of women in our university’s student politics has improved year-on-year, which is an encouraging fact. Moreover, 2 parties this year have women topping their candidate lists, something no party did last year.
That being said, women continue to be ranked below men in candidate lists. But with the difference narrowing down to 1.72 this season, I am confident that we will achieve complete equality soon.
I leave you with the gender composition of the HoR, 2017–18:

It will be interesting to see whether this changes this year, and by what magnitude!
By Anushree Pratap (UG ‘23) and Ishita Ahuja (UG ‘23) A survey conducted from August 6
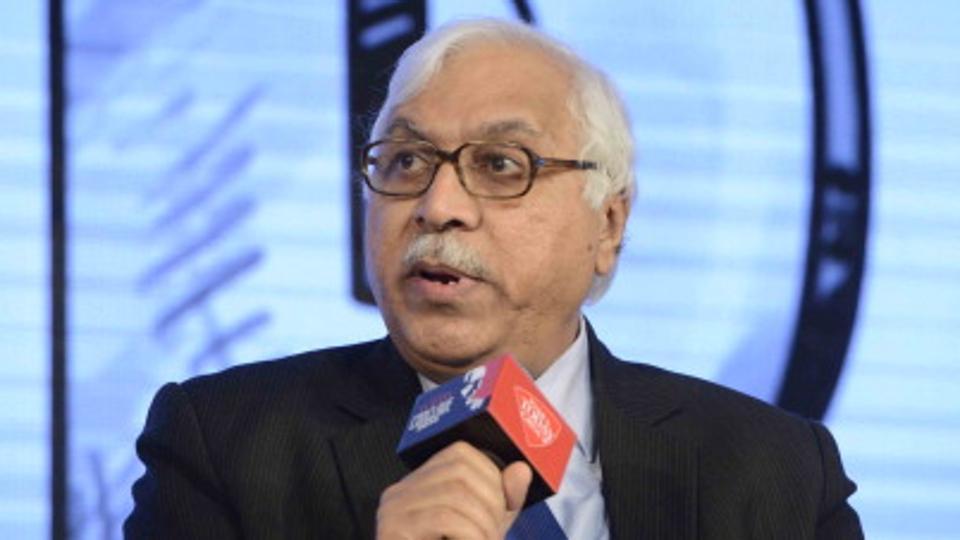
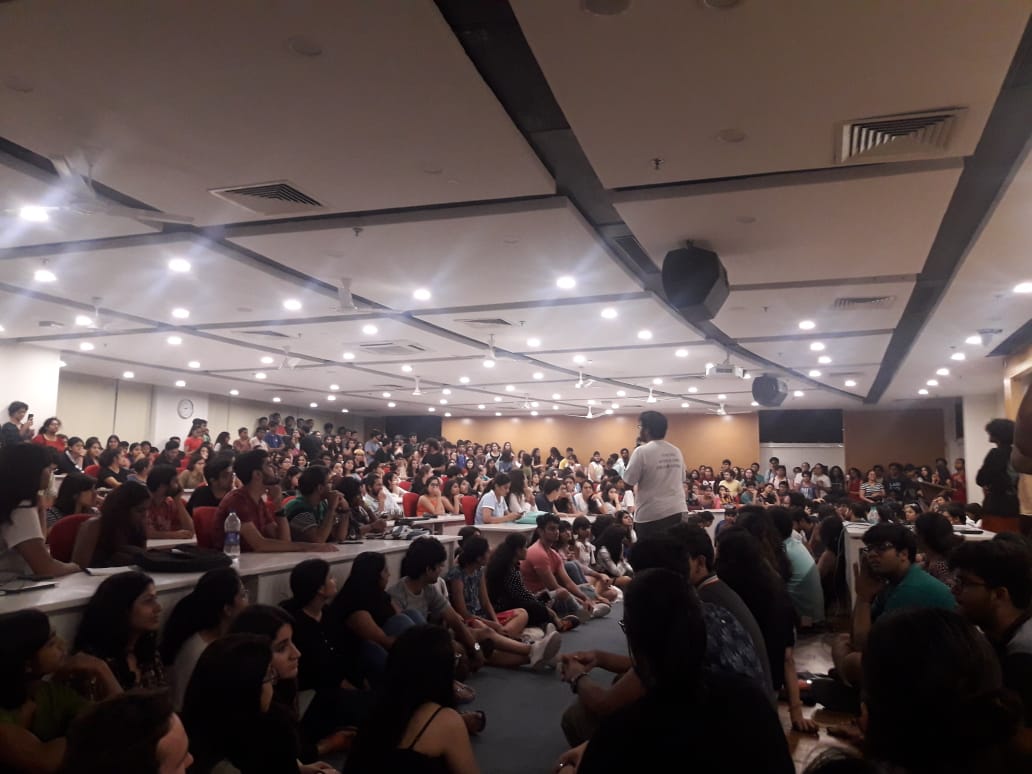
Anjana Ashok, UG22 On October 30th, the Ashoka Distinguished Policy Speaker Series hosted a talk with
Gayatri Kulkarni, UG21, Over the past few months, The Office of Student Life (OSL) has taken